Maps At a Glance
Civic Platform maps use Accela GIS to find locations and view a geographical display of agency records such as parcels, permits, inspections, plans, assets, work orders, and service requests. The map viewer provides users a visual understanding of transactional records to help identify and analyze land-use, zoning, inspection or service request routes, infrastructure, and other geo-centric information.
Accela GIS is the next generation version of the Accela Silverlight GIS map viewer. Accela GIS map users will quickly feel at ease using the new interface. It utilizes a JavaScript-based framework and provides an enhanced user experience when viewing and working with geographic information.
Let’s take a glance at what you can do with the Accela GIS map viewer:
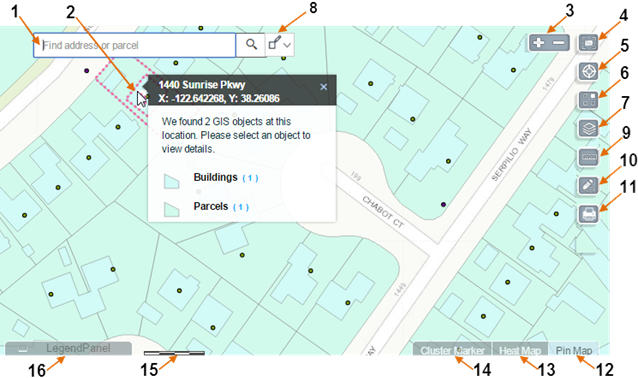
| 1: | Find an address or place. Enter an address or place to move the map to that location. To learn more, see Finding an Address or Place. |
| 2: | Point, click, and see “what’s here”. A context menu shows your selected map location’s address, coordinates, and all associated GIS objects. You can choose a GIS object and perform actions related to the GIS object or transactional records. To learn more, see Selecting Map Features. |
| 3: | Zoom in or out. Alternatively, you can also zoom in by double-clicking, or using the mouse wheel. You can also pan the map by clicking on a spot and dragging the mouse. |
| 4: | Reset the map display to the Default extent, which is the initial extent or initial area shown on the map. The default extent is configured by the administrator of the map service provider. |
| 5: | Locate your (browser's) current location, bookmark, or navigate to a bookmarked map location. To learn more, see Navigating to a Bookmarked or Browser Location. |
| 6: | Choose a Basemap. From the Basemap gallery panel, select a basemap which provides a geographical background for displaying GIS information. |
| 7: | Customize the display of map layers. To learn more, see 1-mapLayers.html#iddcf8f07a-cb77-4ce6-81ae-1882e55071a7. |
| 9: | Measure an area, distance, or the geographic longitude/latitude location. From the Measure panel, you can select which one to measure, and the unit of measure. Click the point(s) on the map to perform the measurement. |
| 10: | Draw a line, shape, or text. From the Draw panel, you can select a drawing tool, select color, style, and transparency, and see a preview. To learn more, see Redlining and Annotating a Map. |
| 11: | Print the map into a PDF or another selected format. To learn more, see Printing a Map. |
| 12: | See a Pin Map to view map locations using pin markers. This is the default view. |
| 13: | See a Heat Map to view map locations using gradient hotspots. |
| 14: | See a Cluster Map to view map locations using numbered dots to represent grouped locations. As you zoom into 1:2500 or below, the individually plotted locations display. |
| 15: | See the map scale or ratio of measurement on a map compared to the actual distance. The scale and unit of measurement is provided by the map service. |
| 16: | View the Legend to understand the map symbols, as provided by the map service. |